Paul Data Visualization
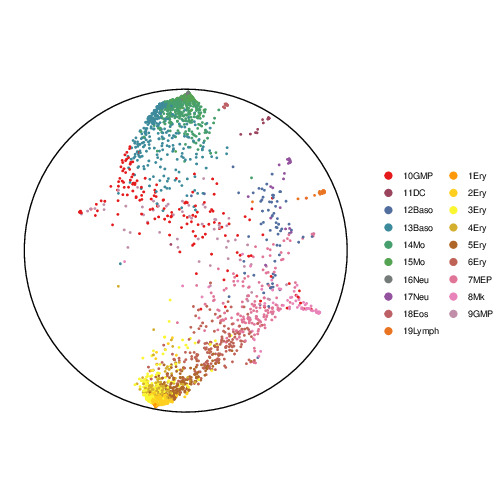
Paul data contains about 2000 cells profiled from murine bone marrow. The authors identified 19 clusters in the data and we projected the Paul data to 2D Poincaré space by using scDHMap. The data has predefined root cell and three branches: two long branches and one short trunk.
Note: You can pause and play the animations by clicking on them.
Pre-training
In the pre-training stage, only the ZINB autoencoder is optimized.
Training
The training stage optimizes the whole model, including the hyperbolic t-SNE regularization.
Perplexity
The pictures below are visualizations of the effects from using different perplexity settings.

The perplexity parameter controls how many neighbors are included in the t-SNE regularization.
Gamma
The pictures below are visualizations of the effects from using different gamma settings.
The gamma parameter is the coefficient of the Cauchy kernel. It controls the strength of the repulsion between two dissimilar bonds.